

Hello, I’m Veronica
The sky is not completely dark at night. Were the sky absolutely dark, one would not be able to see the silhouette of an object against the sky.


-
1st Law = Maximize Pull
In my post, What’s so Wrong with Pushing, I showed by analogy how Time Blocked Iterations, Story Points and Burn Down Rate enabled a superior pull mechanism over traditional management for development teams. In this post, I’ll quantify how to maximize results from that pull system.
There are three, sometimes opposing objectives in maximizing the effectiveness of development teams:
- We want to maximize the throughput or story points delivered from a team. This gives us more features – an obvious benefit.
- We also want to minimize the cycle time to create those features so that we build them quickly – another obvious benefit.
- We want to minimize the work in process or features being developed at any given time. This is a less obvious, but equally important objective
Benefits of minimizing the work in process are that it:
· Ensures the team is fully focused on the most valuable features
· Clarifies requirements and acceptance criteria
· Allows more flexibility by delaying decisions until facts are most clear
· Simplifies communication
· Minimizes the impact of defects
· Minimizes impact of changes or new understandingThis applies to all activities of an iteration for each feature: requirements, design, build, test, deploy.
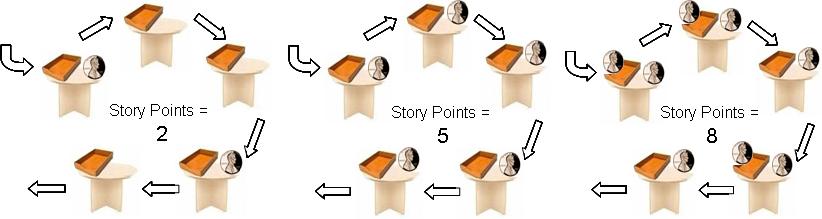
Let’s use desks to represent those activities and imagine a development process where features go sequentially through the five activities. The desks don’t represent number of people on the team, just iteration activities. Each feature has some value of effort assigned to it or number of story points. We’ll use pennies to represent the number of story points being worked. If our objective is to maximize burn down rate and minimize the iteration time, what number of story points should the team have in process at once?
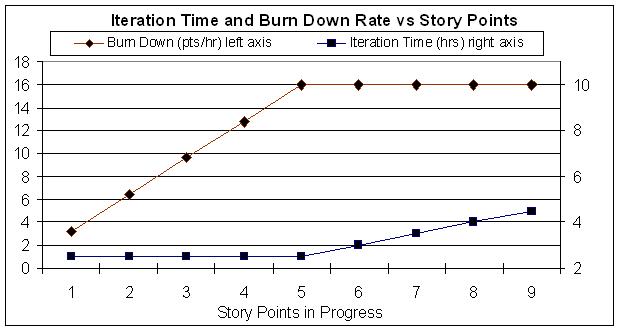
In manufacturing workshops, I’ve run this setup as a simulation with three scenarios, where the number of pennies is 2, 5, and 8. For simplicity, we assume each activity takes the same amount of time, say half an hour (simulated in minutes) per story point, and only one story point can be processed in each activity at a time. New story points can only enter after another one has finished all activities. After running this for 8 simulated hours, which scenario delivers the most story points fastest? Actual results closely follow the graph below:

From this graph, it should be obvious that at some critical number of story points being worked (5 for the simulation,) the team’s productivity (burn down rate) is no better, but they will work longer to complete each story point (Iteration time grows longer.) In fact, there is a physical relationship between these elements which creates my First Law of Agile Physics:
Iteration Time = Work in Progress / Exits = Story Points in Progress / Burndown Rate
This relationship will be obvious to agile managers and teams. It is fundamental to the process of pulling work into agile teams. Perhaps not as obvious, is the important inflection point in this relationship which defines a needed optimization
Burn Down Ratebest = Iteration Time / Story Points in Progresscritical
and Iteration Timeoptimal = Burn Down Rate / Story Points in Progresscritical
In practice, there are no story points sitting in developer’s inboxes, so the components of this equation are measured empirically in the first few iterations of development. Philosophically, it is important that the concept is kept at top of mind so that the three components are always being balanced for maximum overall benefit by releasing as close as possible to the crucial number of story points into each iteration and monitoring burn down rates closely.
Credit: Again, this post is developed from Wallace Hopp’s and Mark Spearman’s great book Factory Physics, Foundations of Manufacturing Management, Mcgraw-Hill/Irwin, 1996. Manufacturing students will recognize this as a derivative of Little’s Law (CT = WIP / TH.) I have a couple more laws to develop from the book before moving on to more generic principles of work physics.
-
Getting Real from 37Signals
If you have not already read the philosophies of 37Signals’ development, it is time well spent. You can read Getting Real on-line. It overviews the software development ideas that created such programs such as Ruby on Rails and Basecamp. Using simple language and numerous case studies, they layout understanding that agile advocates should have as background. Here’s a teaser from their introduction:
Want to build a successful web app? Then it’s time to Get Real. Getting Real is a smaller, faster, better way to build software.
· Getting Real is about skipping all the stuff that represents real (charts, graphs, boxes, arrows, schematics, wireframes, etc.) and actually building the real thing.
· Getting real is less. Less mass, less software, less features, less paperwork, less of everything that’s not essential (and most of what you think is essential actually isn’t).
· Getting Real is staying small and being agile.
· Getting Real starts with the interface, the real screens that people are going to use. It begins with what the customer actually experiences and builds backwards from there. This lets you get the interface right before you get the software wrong.
· Getting Real is about iterations and lowering the cost of change. Getting Real is all about launching, tweaking, and constantly improving which makes it a perfect approach for web-based software.
· Getting Real delivers just what customers need and eliminates anything they don’t.
Getting Real delivers better results because it forces you to deal with the actual problems you’re trying to solve instead of your ideas about those problems. It forces you to deal with reality.
More information and downloadable samples are available from their blog.
-
What’s so Wrong with Pushing
In agile development, much emphasis is rightfully placed on burn down rate, the number of story points completed within an iteration of development. I’ve never been fully satisfied with explanations for why this measure and control of it is so critical. In reality, burndown is only meaningful when story points are limited in a time-blocked iteration.
To develop my perspective, let me step back and use analogy from manufacturing. I promise it all comes together in the end.
When computer software started managing factories in the 60’s, a team of IBM analysts developed Materials Requirements Planning (MRP or Push control system). The idea was that you could break down any manufactured assembly into its component parts, assign lead times to each for how long it needed processing before it was joined to a larger assembly and have the system release or Push parts to work stations for construction at the appropriate time. MRP became a hit in the US and Europe. By some estimates sales of MRP systems reached almost 1/3 of all software sold in the US in the late 1980’s.
Then along came Toyota. As MRP’s popularity crested, Toyota was out manufacturing the US and took a large part of the rap for the decline of American manufacturing. Their secret weapon: Kanban. In Japanese, Kanban simply means “card.” Here the idea was that when a work station was ready for more parts, they sent authorization or a card to request it. The amount requested was a fixed amount determined by the cycle time of manufacturing and rate of processing. This rippled back through the process to Pull work along each step of production.
Comparison of push to pull manufacturing control systems. Adapted from Hopp and Spearman, Factory Physics, Foundations of Manufacturing Management, Mcgraw-Hill/Irwin, 1996, p 163.
How could a simple card take down the computing power of IBM? In looking for the answer to why Push did not work, pundits, and scholars of the 1980’s used similar arguments that we hear today for why traditional project management does not yield better results: The parts data needs to be more accurate. Master production schedules needed to be more realistic. More training is required to teach the concepts. Top management needs to be more involved.
Eventually, most agreed that the true fundamental problem was that Push is based on a flawed model. Lead times for Push calculations are attached to parts that have no awareness of what is actually happening at their work stations. If the work stations are idle, the same amount of work is scheduled as if they are working overtime. This problem is complicated by the fear that a late start for a part can cause it to miss final assembly which encourages inflated lead times and even more work to get scheduled for already backed up work stations.
Pull systems solved this flaw by using the card as a signal to indicate the state of the work station. Only when a work station is able to take on more work, is it requested. And, then, only for an amount that can be processed quickly while maximizing throughput.
Kanban boards are a simple way to apply a pull system to a team working together. When properly done, they limit the number of cards that can be in any phase of work for a team. New work cannot be pulled in for the team to work on until there is space on the board for a new card. This space is only created by finishing the work of a previous card.
Iterative development is another way to create pull. Work is pulled by measuring how much is completed in an iteration by measuring burndown. This sets a limit to the number of story points (units of work) in a time-blocked iteration. Each iteration pulls only as many story points as the burndown chart demonstrates is possible to complete within an iteration. Together story points, burndown charts, and time-based iterations enable pulling work to maximize team and project performance.
How to apply these and the the first of the “laws of development physics” are coming up next.
Credits: Much of what is covered in this post is credited to Wallace Hopp’s and Mark Spearman’s great book Factory Physics, Foundations of Manufacturing Management
, Mcgraw-Hill/Irwin, 1996 and the application of its principles while working at George Group. I pulled my original edition off the shelf last week. A 3rd edition has since been released. So much of what they discuss in this book has application to development processes and broadly to any business process. I encourage anyone searching for fundamental principles to dig into it. I’ll be referring to it as I further develop some of my “laws of development physics.”
-
2nd Law = Bad News Ages Poorly
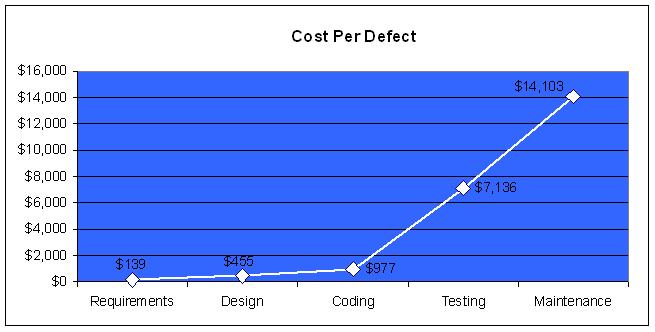
I recall from my early consulting days a graphic that was often hauled out at management meetings and retrospectives. It looked something like this:

I’ve often wondered the source of this wisdom and discovered after some research that it comes from Capers Jones, Software Assessments, Benchmarks, and Best PracticesIn pondering the graph, what should one conclude? Search Google, and top results use it to justify the investment of extra time, effort, and capital in fixing errors during the early tasks of requirements, design, and coding. Spend enough in these tasks and a reasonable conclusion is a savings of $2,276,700 on a typical project.
What if, though, we assumed instead of phases on the horizontal axis, it merely represented time? The conclusion would be quite different. If we could complete requirements, design, coding, testing and acceptance in the time typically taken for requirements alone, we would never pay 10 times the starting cost to fix a defect. Instead of saving money, added time in the single task of development almost guarantees higher costs of correcting defects later in the time line.
I’d like to do the scholarly research of Capers around this to get empirical data. In the absence of that, using anecdotal evidence from applying agile to software development for the last eight years, I feel much more comfortable with this model. I’ve been on very long projects where early assumptions proved wrong or changed because different interest groups looked at them later. I’ve experienced long requirements cycles that delayed introduction of software only to find out that key features were missing. With agile, development happens across all phases more quickly and these problems are largely alleviated.
Thus, my second “law of agile physics”: The cost of correcting a defect rises exponentially with the time taken to identify the defect. Or more generally, bad news does not age well. (The first law is coming next.)
-
Call for Panelists
I am moderating a panel discussion in June and am looking for panelists interested in participating. It is for a BusinessAnalystWorld Symposium Conference and is titled The Role of the BA in an Agile Environment on June 9, 2008 from 9:45-11:00am in Denver. I would like to get perspective from practitioners in organizations of different sizes and experience levels on the road to Agile Software Development. If interested leave me a comment or message. I am also giving a talk later that afternoon if you want to attend or send representatives: Agile Thoughts – Exploring the Philosophy and Mechanics that Make Agile Work on June 9, 2008 from 1:45-3:00pm. I will be exploring some of those topics in a series of upcoming posts.

About Me
The sky is not completely dark at night. Were the sky absolutely dark, one would not be able to see the silhouette of an object against the sky.
Follow Me On
Subscribe To My Newsletter
Subscribe for new travel stories and exclusive content.
